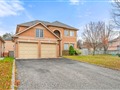
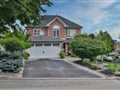
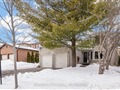
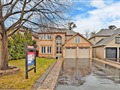
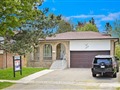
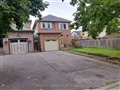
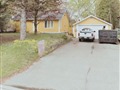
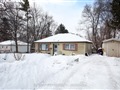
2029 Cedarwood Crt
$1,414,387
Comparative Market Analysis
Jun 27, 2025
NOT AN ACTIVE LISTING
Historical Performance
| Period | $ Change | % Change |
| 1 Day | +$389 | +0.027% |
| 7 Days | +$232 | +0.016% |
| 30 Days | -$2,519 | -0.178% |
| 3 Months | -$4,061 | -0.286% |
| 6 Months | +$23.5k | +1.69% |
| 1 Year | -$65.6k | -4.43% |
| 3 Years | +$252k | +21.7% |
| 5 Years | +$443k | +45.6% |
| 10 Years | +$852k | +152% |
List My Property
Real Estate Statistics
Financing Solutions
Browsing History
2333 Meriadoc Dr, Pickering
2 seconds ago
1198 Canborough Cres, Pickering
3 seconds ago
1240 Charlotte Circ, Pickering
4 seconds ago
895 Antonio St, Pickering
5 seconds ago
1355 Everton St, Pickering
6 seconds ago
1516 Rawlings Dr, Pickering
7 seconds ago
1544 Rawlings Dr, Pickering
8 seconds ago
AS SEEN ON


Are You a Licensed Real Estate Agent or Broker?